Sources are not just for reading — sometimes they are for counting. Word frequencies across a whole manuscript, sentence lengths by chapter, how often each character actually appears versus how often you think they appear: these are computations, and AGIT runs them locally in Python, then draws the chart.
Below is a small live demo of the idea: paste text, get statistics and a chart. It runs in your browser, and uploads nothing — the same deal the real tool offers, except the real one reads your project.
Sample output without JavaScript: 120 words, 8 sentences, top terms spider, web, silk.
How it works in the app
A scratchpad with guard rails
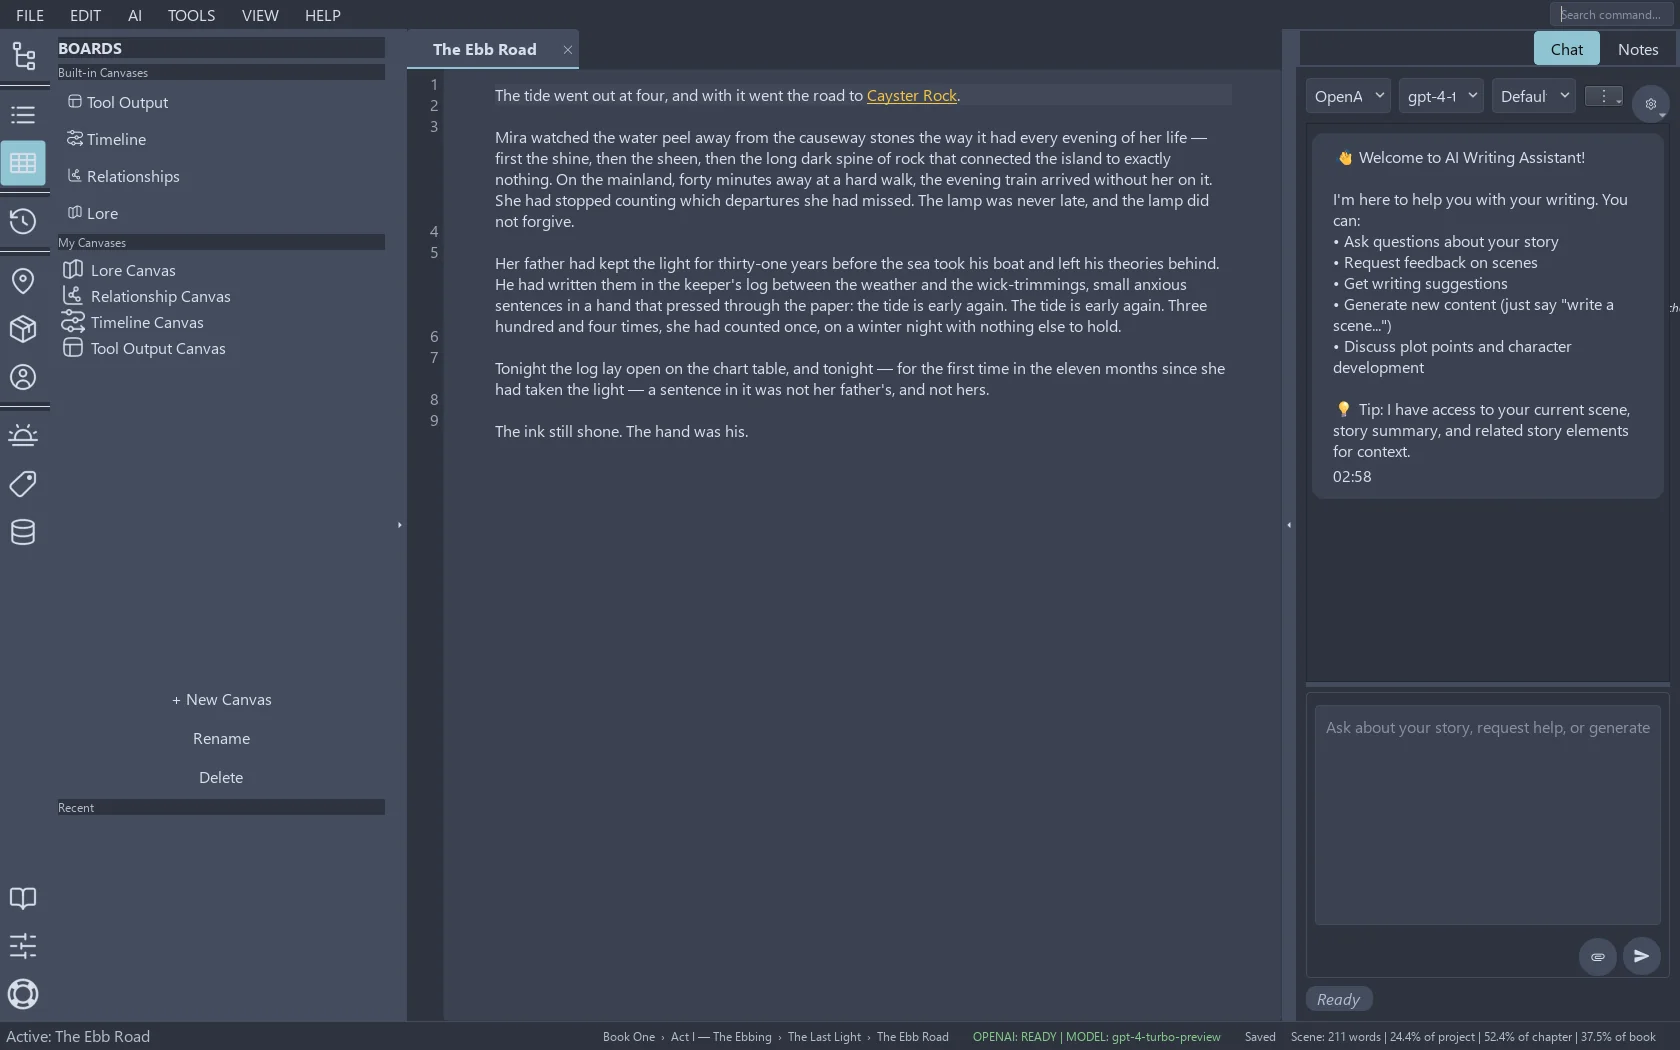
AGIT includes a Python tool canvas — a scratchpad where small programs run against your project's data. Pick the scenes, documents or notes you want measured, describe or write the computation, and the output lands on the tool canvas: tables, numbers, charts. It never writes into the manuscript by accident, because the manuscript is not where tool output goes.
Under the hood this is ordinary Python with the libraries data people already trust — pandas for tables, matplotlib for charts — running on your machine. Your data never leaves it.
Tool output lands on its own canvas — never in the manuscript.
What it is good for
Pacing checks: sentence length and paragraph length per chapter, so the chase scene is not written in the same rhythm as the tax returns.
Presence audits: which character names appear in how many scenes — and which have quietly disappeared since act one.
Vocabulary watch: your most-repeated words, the crutch words you promised to quit this draft.
Research counts: term frequencies and dates across imported sources, for the non-fiction writers keeping score.
Numbers do not write the book. They just tell you which chapter is lying to you.
We use only functionality and necessary cookies. No third-party trackers ride this web.